What Salary Puts You in the Middle Class Across All 50 U.S. States?
A recent research has disclosed the salary required for a middle-class life across all U.S. states, showing that this minimal income can differ by as much as $30,000.
The American middle class represents a wide socioeconomic segment positioned between the affluent upper class and the economically struggling lower class. usually characterized by financial status , education, and lifestyle.
In financial terms, the middle class typically includes households whose earnings fall within a range of one-half to twice the nation’s median household income—currently standing at $77,719 per year, as reported by the U.S. Census Bureau.
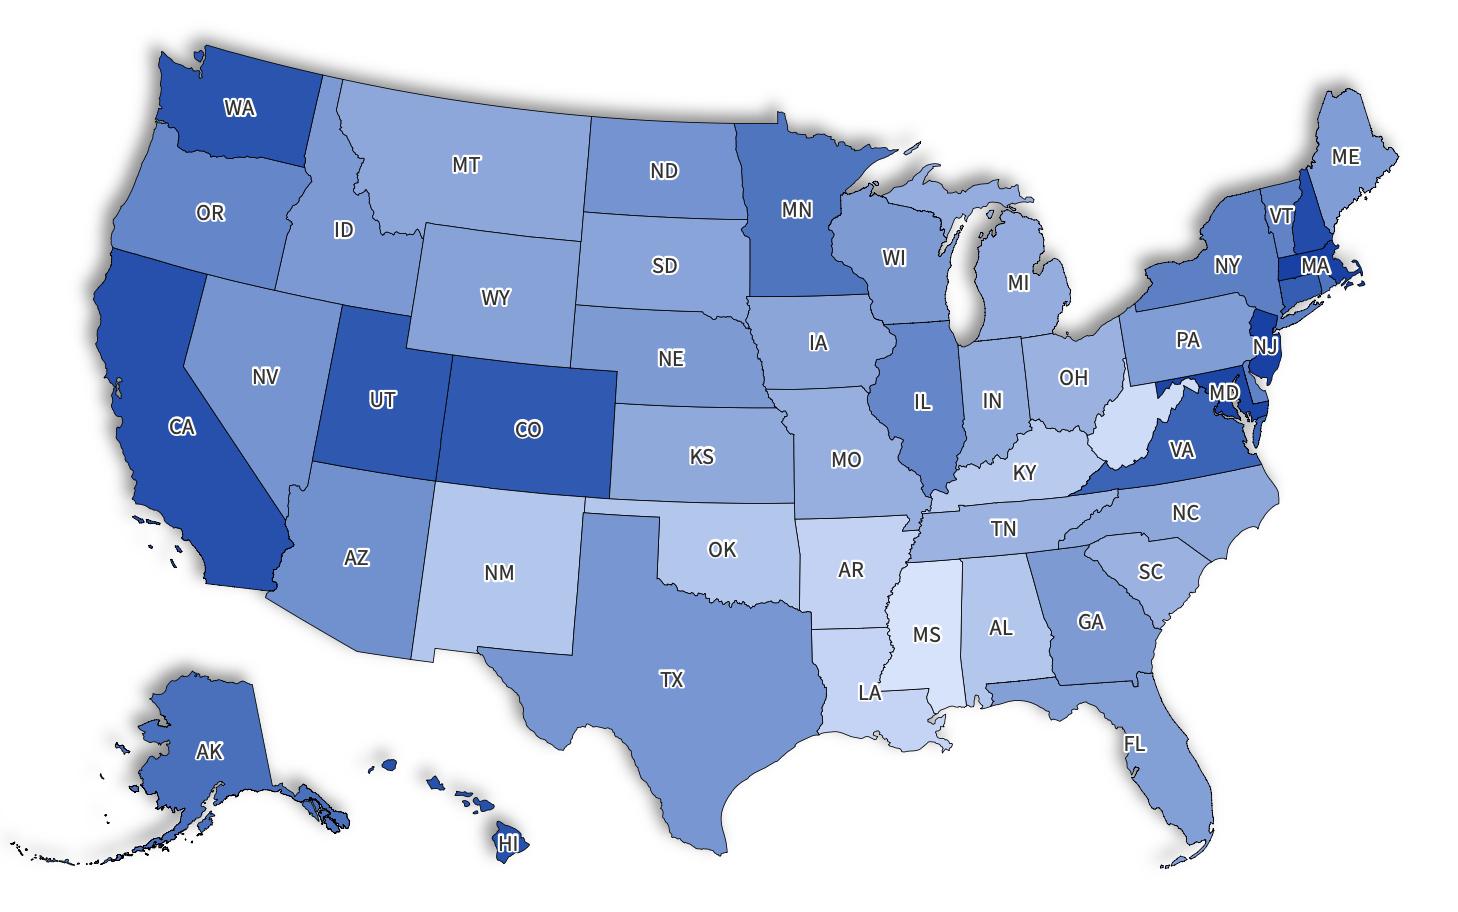
According to SmartAsset’s report, which utilized data from the U.S. Census Bureau, the most expensive state for maintaining a middle-class lifestyle is Massachusetts, with costs ranging from $66,565 to $199,716 annually. It is closely trailed by New Jersey at $66,514 to $199,562 and Maryland at $65,779 to $197,356 per year.
On the opposite end of the scale, Mississippi stands as the most affordable state for a middle-class lifestyle. In this state, the required amount ranges from $36,132 to $108,406.
Coming in as the second-to-last is West Virginia, where individuals must earn between $37,295 and $111,896 annually to fall into the middle-class bracket. Similarly, in Louisiana, which ranks third from last, you would need an income ranging from $38,815 to $116,458 for the same classification.
In California, which holds the title of the most populated state, it ranks fifth when it comes to maintaining a middle-class life. This requires an income ranging from $63,674 to $191,042. As for Texas, being the second most populated state, it falls somewhere in the middle of this ranking. To be considered part of the middle class here, residents need earnings spanning from $50,515 to $151,560.
Across all states, the median income resides within these limits, indicating that most residents fall into the middle-class category.
What Is the Income Required for Middle-Class Status in Every State?
As stated in the report, your income should fall within these ranges to qualify as part of the middle class across all states in the U.S.:
- Massachusetts : $66,565 - $199,716
- New Jersey : $66,514 - $199,562
- Maryland : $65,779 - $197,356
- New Hampshire : $64,552 - $193,676
- California : $63,674 - $191,042
- Hawaii : $63,542 - $190,644
- Washington : $63,064 - $189,210
- Utah : $62,274 - $186,842
- Colorado : $61,934 - $185,822
- Connecticut : $61,104 - $183,330
- Virginia : $59,948 - $179,862
- Alaska : $57,748 - $173,262
- Minnesota : $56,718 - $170,172
- Rhode Island : $56,642 - $169,944
- New York : $54,725 - $164,190
- Delaware : $54,235 - $162,722
- Vermont : $54,135 - $162,422
- Illinois : $53,532 - $160,612
- Oregon : $53,435 - $160,320
- Arizona : $51,538 - $154,630
- North Dakota : $51,012 - $153,050
- Nevada : $50,904 - $152,728
- Texas : $50,515 - $151,560
- Idaho : $49,956 - $149,884
- Georgia : $49,750 - $149,264
- Wisconsin : $49,749 - $149,262
- Nebraska : $49,722 - $149,180
- Pennsylvania : $49,211 - $147,648
- Maine : $49,150 - $147,466
- Florida : $48,869 - $146,622
- Wyoming : $48,272 - $144,830
- South Dakota : $47,869 - $143,620
- Iowa : $47,617 - $142,866
- Montana : $47,198 - $141,608
- North Carolina : $47,198 - $141,608
- Kansas : $46,884 - $140,666
- Indiana : $46,313 - $138,954
- Michigan : $46,117 - $138,366
- Missouri : $45,692 - $137,090
- South Carolina : $45,198 - $135,608
- Ohio : $45,175 - $135,538
- Tennessee : $45,083 - $135,262
- New Mexico : $41,508 - $124,536
- Alabama : $41,471 - $124,424
- Oklahoma : $41,421 - $124,276
- Kentucky : $40,741 - $122,236
- Arkansas : $39,129 - $117,400
- Louisiana : $38,815 - $116,458
- West Virginia : $37,295 - $111,896
- Mississippi : $36,132 - $108,406
The Changing Middle Class
Although the middle class—which encompasses most Americans—is traditionally seen as the foundation of the U.S. economy, fueling consumption and expansion, various elements like wages staying flat, increasing cost of living , and changes in the economy have affected its stability and scale over time.
Based on data from the Pew Research Center, the proportion of Americans who The middle-class population has decreased. Over recent decades, in 1971, 61 percent of Americans resided within middle-class households; however, by 2023, this proportion had dropped to 51 percent.
The study revealed that over the decades, the rise in the proportion of people seen as part of the upper class exceeded the growth in the portion classified as having lower-class incomes. Between 1971 and 2023, the percentage of Americans living in lower-income homes rose from 27% to 30%, whereas the segment dwelling in higher-income brackets climbed from 11% to 19%.
Related Articles
- GDP Isn't the Proper Metric for Assessing America's Economic Power | Opinion
- Democrats Must Abandon Their Elitist Attitudes to Regain Victory | Opinion
- The Top 10 Most Budget-Friendly U.S. Cities for Middle-Class Residents
- Donald Trump, The Ultimate Class Betrayer | Opinion
Start your unlimited GudangMovies21trial


Comments
Post a Comment